Collect Earth Online (CEO) is a powerful online tool for collecting information using image interpretation. However, when internet availability is temporarily reduced or eliminated as in low- or no-internet situations, project administrators may need an alternative to CEO’s online imagery availability. Low-internet situations include situations where the CEO Data Collection interface will load, but online imagery will not, because online imagery requires more bandwidth than is available.
Fortunately, you can now use CEO and SEPAL to create offline imagery for your projects for use in these instances.
We’ve put together a helpful step by step guide for you. You will need both CEO and SEPAL accounts. These directions assume you have already created your project for collecting plot information.
🧭 Download the CEO Offline Imagery Plot Data
First, we need to obtain shapefiles for your plots. If you created your project with shapefiles, you can use these. Otherwise, follow the steps below.
Navigate to your project’s Project Management page in CEO.
Click on the “Download Shapefile” button.
Save the file.
📋 Get ready to use the offline imagery creation tool in SEPAL
Next, we will generate imagery using the plot shapefiles in SEPAL.
Please note that creating an account may take a day to be approved.
Otherwise, sign in to your SEPAL account.
You will need to start a larger instance.
Open the Terminal (blue icon).
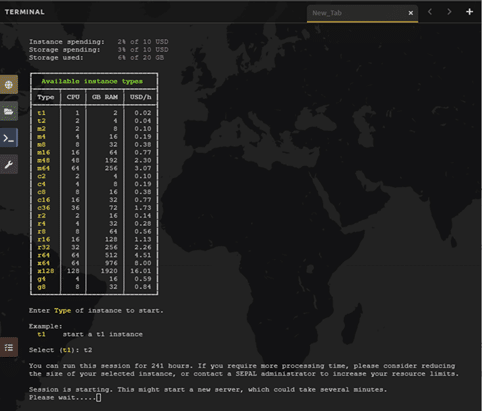
When you initially load the Terminal, you will see information about your usage and the available types of instances you can initialize.
To increase the size of your instance, first examine the “Available instance types” table. This is updated periodically but an example is shown below.
Choose an instance Type that fits your needs. Frequently a t2 or m2 is sufficient and cost effective, though for large projects you may need a larger instance.
SEPAL Terminal with different sized instances available to choose from.
Next to the “Select (t1):” text, type in ‘m2’ or your chosen instance type.
Press Enter on your keyboard.
Wait for the new instance to start. This will take several minutes.
You will need to upload the file you just downloaded from CEO to SEPAL. We will use RStudio to upload the file. (Note: If you are an advanced user, you can use the Terminal to load data using the command line and skip this section).
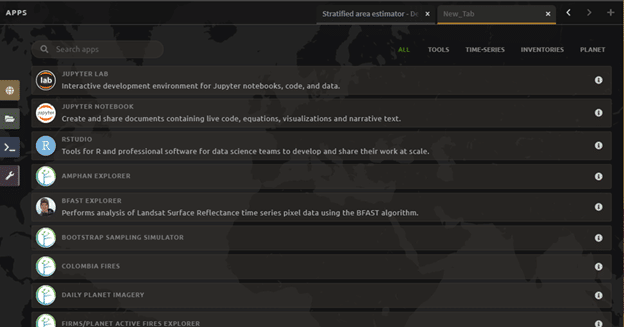
First select the purple wrench Apps button. If you have an existing tab open, you may need to click the plus sign in the top right.
To use RStudio, choose the R Studio application. You may be prompted to enter your SEPAL username and password to enter R Studio.
The Apps list in SEPAL.
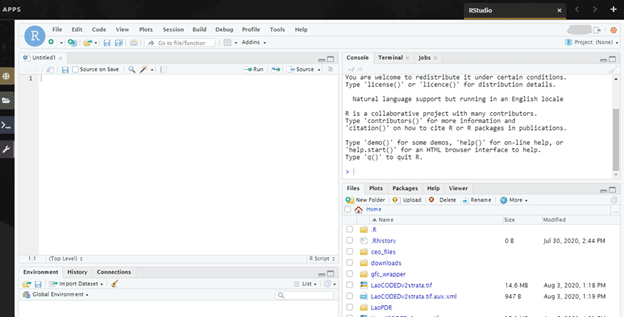
This will open an instance of RStudio, an IDE for the R programming language.
You should see a ‘Files’ tab in the lower right window. If not, you may need to adjust the window layout. To do this, move your mouse to the right-hand side of the window where a four-way arrow will appear. Click and drag your mouse to the left to reveal the right pane.
Click the Upload button that is located in the lower right side of the R Studio interface.
The R Studio interface in SEPAL.
In the Upload Files window, click Choose File.
Navigate to the correct location on your drive, select your map and click Open.
Once you’ve selected this file, click OK to complete the upload (see below).
You will see your file appear in the list of files in the lower right-hand pane.
You may now close the RStudio instance by clicking on the tab’s x.
🌌 Run the offline imagery creation tool in SEPAL
The Time Series Clip application allows the user to download an auto generated time series of images using customizable dates as a pdf file. Each image is a custom sized square from 500x500m to 1000x10000km in size around the plot centroid or the plot geometry, using a band combination selected by the user.
Navigate to the Apps tab (purple wrench icon).
Type “Time Series Clip” into the search bar.
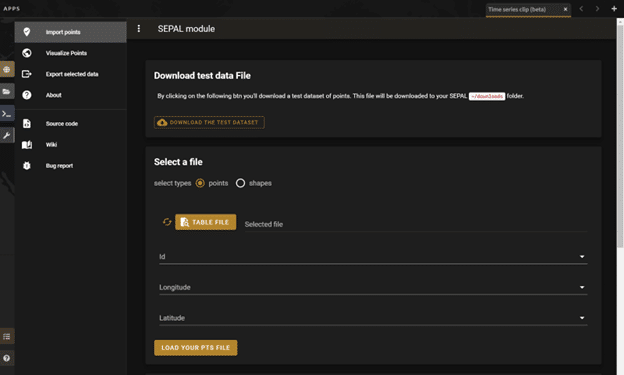
Click on the “Time Series Clip” app. Wait until the application opens.If the application fails to open, close the tab and try again. You may need to start a larger instance.The Time Series Clip App in SEPAL.
Click on the “Table File” button and navigate to your CEO Plot file.
The last step should prompt you to download your offline imagery pdf.
If you would like to have offline imagery from multiple sources or using multiple band combinations, please repeat steps 2 through 6 for each band combination.
If you run into problems with downloading your offline imagery, help for SEPAL can be found in their Documentation section or via their Google Groups.
🏔 Using your downloaded offline imagery
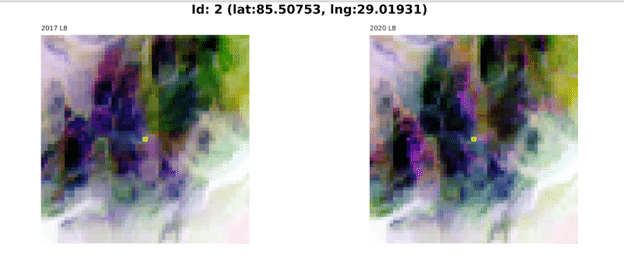
Your downloaded imagery can now be used alongside CEO in low-internet situations. In these cases, the CEO Data Collection interface will load but the online imagery will not. This is because the online imagery requires more bandwidth than is available. This might occur when multiple people are gathered in one location, as during a mapathon. Simply navigate to your CEO project, and while the imagery may not load, you can examine the plot number in CEO and look at the corresponding imagery in your downloaded pdf. Each image in your pdf will have a plot identifier above the image. Multiple years of imagery will be shown on one page.
An example of the output pdf. In this example, the Plot ID is 2, and latitude and longitude are shown at the top. There are two years of false-color data, one from 2017 and the other from 2020.
In no-internet mapathon situations where using CEO is required, please contact us at support@collect.earth for additional assistance. Please allow a few business days for response, and you may be limited in your project design. We can assist you in setting up an offline CEO database for use with your mapathon.
CEO would like to thank its ongoing funders FAO, NASA–USAID SERVIR, and SilvaCarbon, a US government program. Thanks also to CEO’s technology partners: Norway’s International Climate & Forests Initiative for funding open high-resolution data availability; Planet for providing high-resolution imagery; and the Google Earth Engine team for creating a platform for Earth science data and analysis.
Collect Earth Online is working constantly to improve the user experience, and your feedback is invaluable. If you have ideas to share, please write to support@collect.earth.